GBP/USD Daily Outlook 11-April-23
GBP/USD Intraday Outlook and Analysis
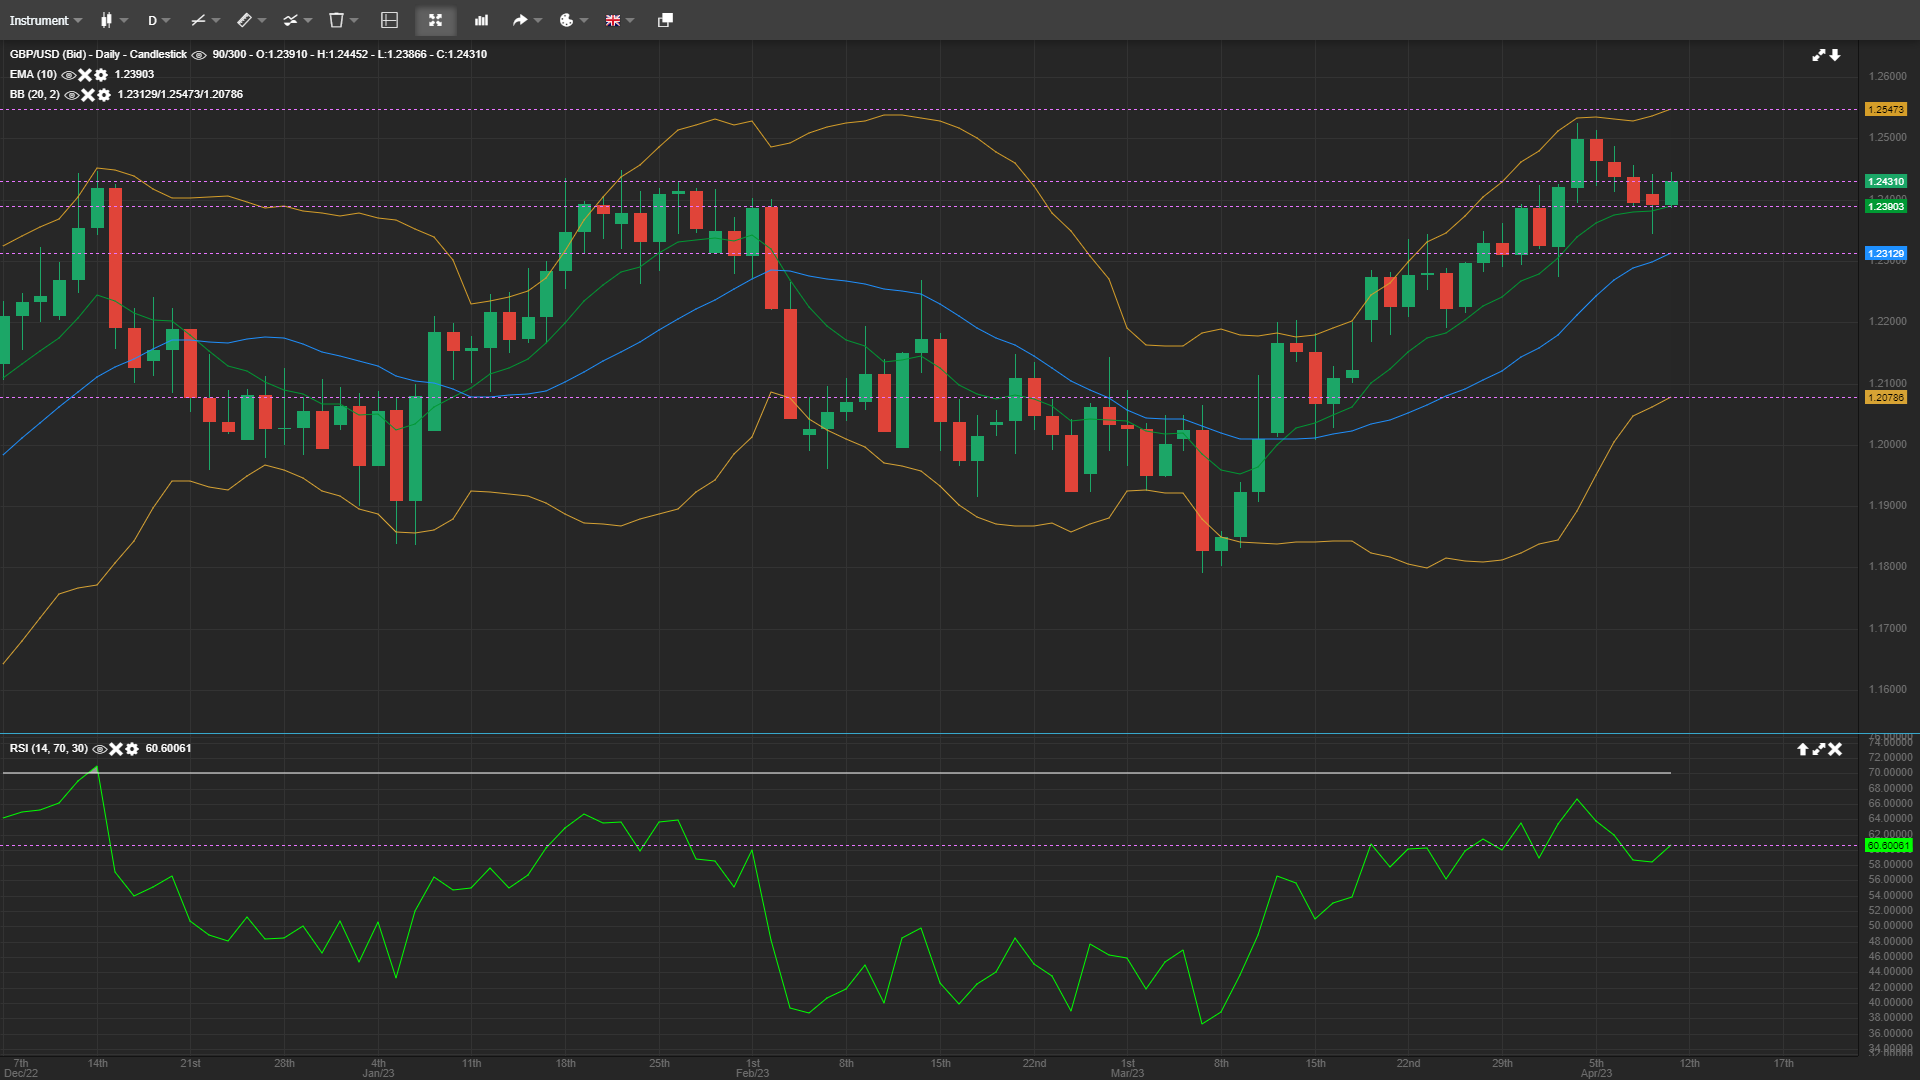
The GBPUSD pair faced resistance at 1.2531, which marked a ten-month high in the previous week, and has since moved lower. However, the pair is now attempting to recover some of its losses.
The momentum indicators are presenting mixed signals, with the MACD remaining below its trigger line in the positive area and the RSI showing a slight upward trend above the neutral threshold of 50. The 20- and 50-day simple moving averages (SMAs) have experienced a bullish crossover, and the pair’s price is still above the long-term ascending trend line.
If the pair experiences further declines, it will encounter the 20-day SMA at 1.2326, followed by the 1.2276 support level and the 50-day SMA at 1.2151, which is a significant obstacle. If the pair falls below the uptrend line, it will reach the 23.6% Fibonacci retracement level of the upward wave from 1.0331 to 1.2531 at 1.2006, and then it will be on the way towards the 200-day SMA at 1.1911.
If the pair reverses upwards, it may face resistance at the ten-month peak of 1.2531 before it can retest the 1.2671 resistance, which was recorded in May 2022. If it rises further, it will encounter the 1.2856 barrier, which coincides with the 200-weekly SMA and the low in November 2020.


