USD/CAD Daily Outlook 11-April-23
USD/CAD Intraday Outlook and Analysis
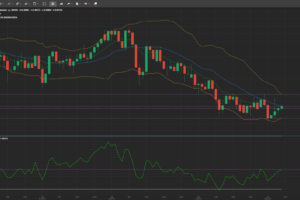
The current trend on the USD/CAD chart is bearish, and there is a chance that this trend could extend towards the first support level at 1.3466. This support level is significant as it represents a swing low support, and also aligns with a 61.80% Fibonacci retracement, making it a stronger support level. The second support level at 1.3417 is also crucial as it serves as a multi-swing low support, indicating a potential area for price rebound.
On the other hand, the chart displays a first resistance level at 1.3559, which is an overlap resistance. If the price manages to surpass this level, it may suggest a potential bullish reversal. However, the second resistance level at 1.3651 is a pullback resistance and coincides with a 61.80% Fibonacci retracement, making it a robust resistance level where the price may change direction.


